How common is "backwards" pitching in Major League Baseball?
Posted: August 29, 2018
_(cropped).jpg)
So far, 2018 has been another outstanding season for Boston Red Sox pitcher Chris Sale. He currently leads the majors in walks + hits per inning pitched (.85) and strikeouts per nine innings (13.5) and his 6.4 pitcher wins above replacement (WAR) is fifth in the majors--and first in the American League.
These impressive numbers don't tell the full Chris Sale story, though. If we focus on how Sale goes about the business of producing these results, and not just the results themselves, we find an interesting fact underneath all of those strikeouts and scoreless innings: despite having an above-average fastball that averages 95 mph this season and occasionally reaches 100, he uses it less frequently on the first pitch to each hitter than just about anybody in the game. In baseball lingo, we'd classify Sale as having a tendency to pitch backwards on the first pitch.
Conventional pitching tactics suggest that a pitcher start each hitter off with a fastball. Part of the underlying rationale is that a pitcher should "work ahead" by improving the chance that the second pitch is thrown with a no-ball, one-strike count, rather than falling behind and putting the hitter in the driver's seat. A well-located fastball with good velocity can also "set up" a pitcher's full arsenal of breaking and offspeed pitches, by influencing the batter's expectations and timing. Sure enough, in the first half of the 2018 season (i.e., games played prior to the All Star break), 65 percent of first pitches were fastballs, compared to 59 percent of pitches after the first pitch. This 6 percentage point difference has remained consistent over the past five seasons. (See the section at the end of the post for details on the data used in this analysis.)
Chris Sale's pitch selection, on the other hand, is the other way around. In the first half of 2018, fastballs represented 48.8 percent of all of Sale's pitches, but only 39.0 percent of his first pitches, for a difference of 9.8 percentage points. These numbers were very similar to those from the 2017 season as well (39.7-48.6=-8.9). Clearly, Sale faces hitters with a significantly different approach than the "average" pitcher. Not only does he use a lot fewer fastballs than the Major League average overall; he also uses significantly fewer fastballs on the first pitch.
And, while Sale is the most extreme example of divergence from a first-pitch fastball strategy (among starting pitchers), he is not alone.
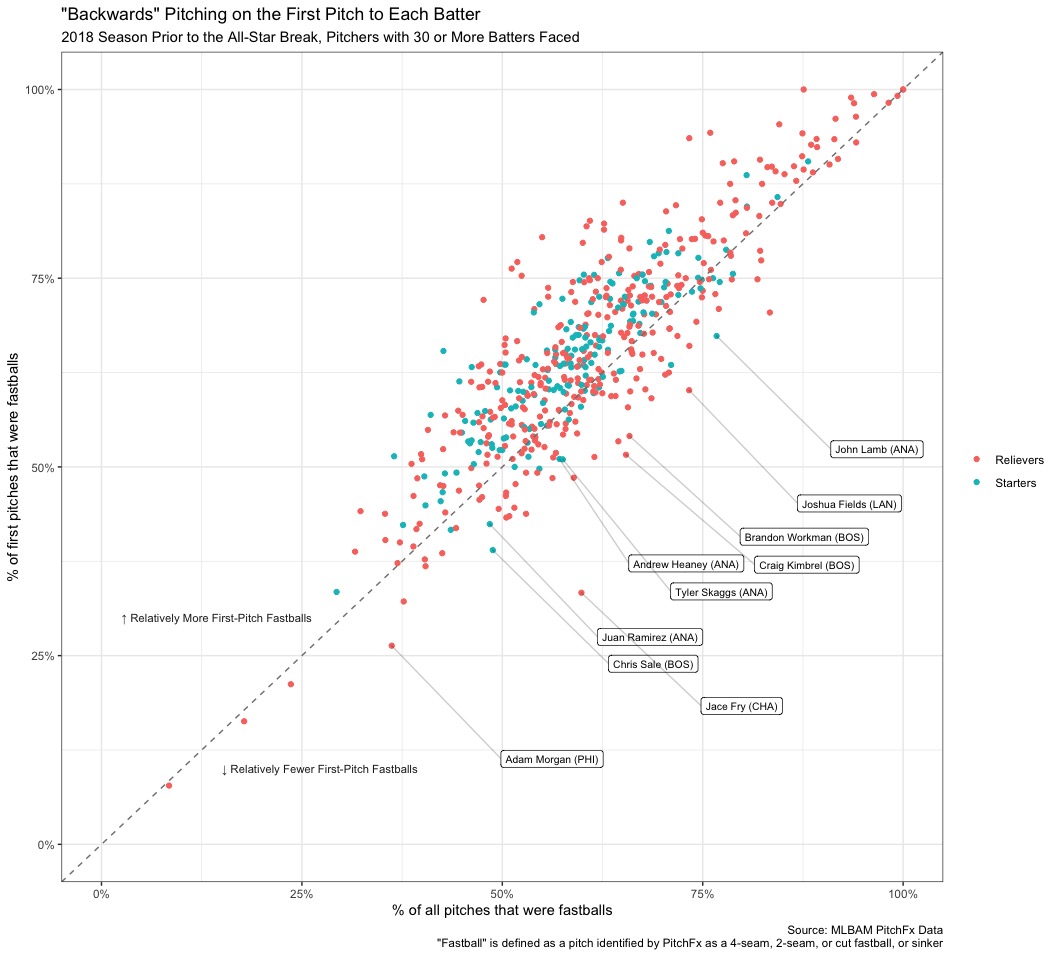
Of the 531 major league pitchers who had faced at least 30 batters in the first
half of the 2018 season, 125 (24 percent) had a higher percentage of overall fastballs thrown than first-pitch fastballs thrown. The following shows the distribution of these 531 pitchers, with the dotted
diagonal line showing the points where a pitcher threw an equal percentage of first-pitch and overall fastballs, and with the most dramatic departures (five starters and five relievers) from
a first-pitch fastball strategy labeled:
But Are They More Effective?
Anyone arguing against the success of Chris Sale (or, for that matter, his teammates Kimbrel and Workman) faces an uphill battle. But does throwing relatively fewer first-pitch fastballs, in and of itself, make them successful, or are they successful because they are just excellent pitchers generally? As a measure of pitcher effectiveness, we will use walks plus hits per inning pitched, commonly known by the acronym WHIP. WHIP is generally regarded as one of the better barometers for pitchers, because it directly measures a pitcher's primary objective: record outs without allowing runners to score. A WHIP value of one or less is generally regarded as the benchmark for excellent, elite pitchers.
When we plot the ratio of each pitcher's overall fastball percentage to his
first-pitch fastball percentage (which we might call the "first pitch backwards ratio") against his WHIP, we see no correlation:
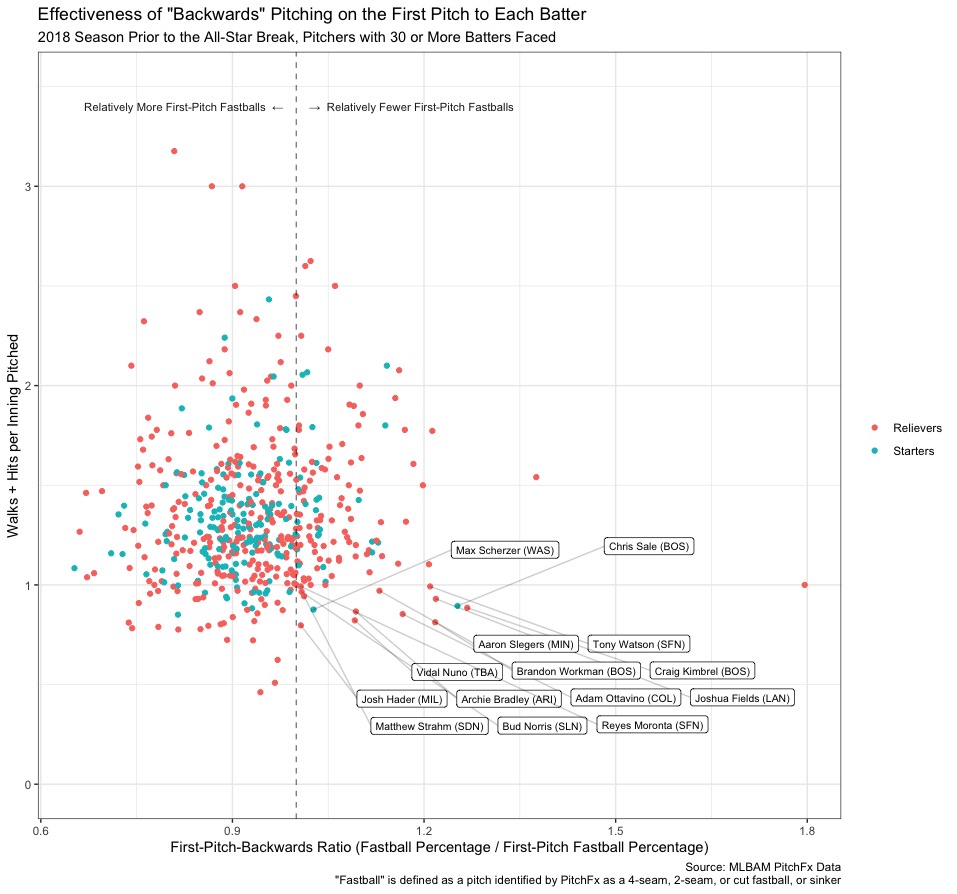
As any fan knows, and as common sense dictates, there is considerable variance in pitchers' effectiveness at preventing walks and hits (or, conversely, at producing outs). But this graphic tells us that whether a pitcher uses a fastball to start off a hitter has little, in and of itself, to do with it. It is interesting to note, though, that the two pitchers that many consider to be the best in each league--Sale, and the Nationals' Max Scherzer--are the only starters among the 14 pitchers that emphasize non-fastballs on the first pitch and have a WHIP lower than one. We cannot argue, based on the data here, that they dominate because of a first-pitch-backwards approach. It does appear, though, that pitching backwards is a tool in the toolbox of some very successful pitchers, and that these players use it as part of an overall effective arsenal against the hitters they face.
Do They Simply Have More Command of Offspeed and Breaking Pitches?
If most pitchers throw fastballs on the first pitch to a batter in order to work ahead, then it might be that backwards pitchers do the opposite for the simple reason that they are effective at throwing their offspeed and breaking pitches for strikes. Perhaps the risk/reward equation for some pitchers is such that they can reap the reward of freezing a hitter with a curveball dropped gracefully on the outside corner or of inducing a swing-and-miss out front of a well-executed changeup, without incurring the risk of a taken pitch outside the strike zone resulting in a 1-0 count.
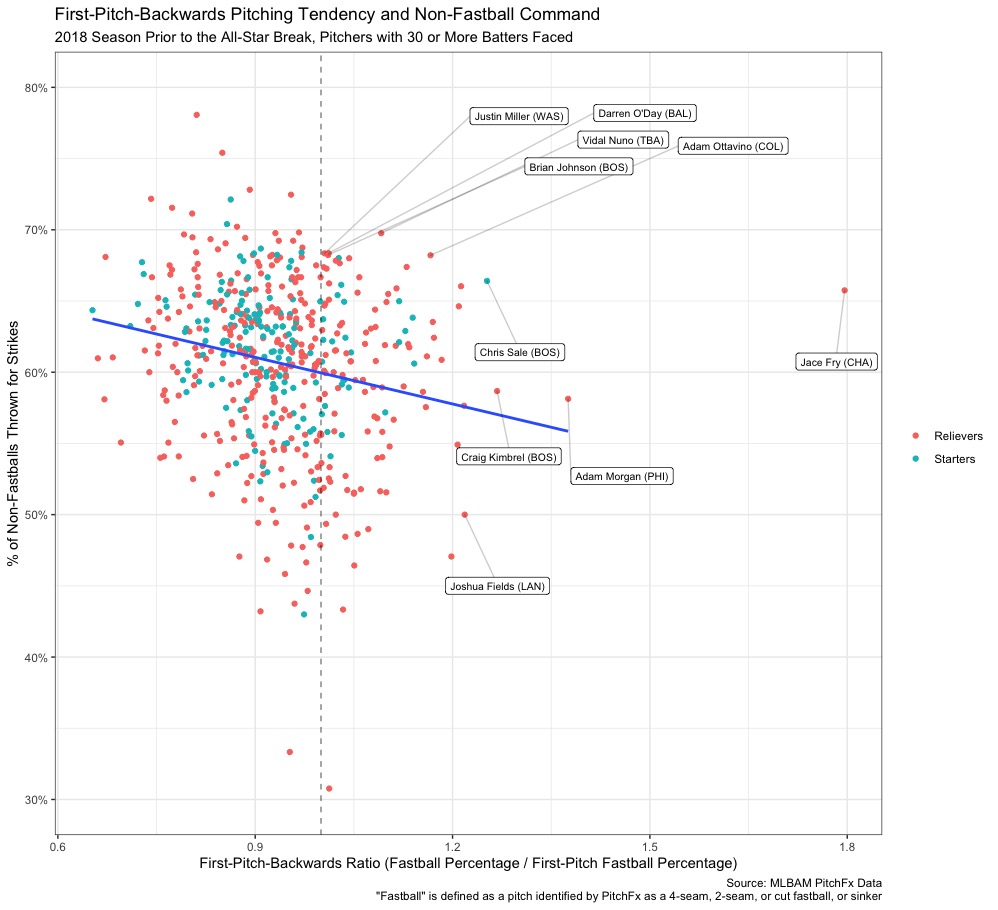
Indeed, first-pitch-backwards pitchers like Chris Sale (66.4%) throw non-fastballs for strikes more often than the MLB average (61.6%). Others, like relievers
Vidal Nuno of the Rays (69.8%) and
Adam Ottavino of the Rockies (68.2%) even get strikes on non-fastballs
more often than they do on fastballs (63.3% and 64.2%, respectively). But in general, across the league, there is only a very loose
correlation between first-pitch-backwards tendency and non-fastball command (Pearson correlation of -0.17). If anything, the more backwards a pitcher's
approach on the first pitch, the less capable he is of throwing non-fastballs for a strike:
So What Can We Conclude About "Backwards" Pitching in 2018?
Sixty-five percent of the time, when a major league batter stepped to the plate in the first half of the 2018 season, he saw a fastball on the first pitch. After the first pitch, he saw fastballs only 59 percent of the time. This overall six-point difference has remained consistent for at least the past five seasons. However, nearly a quarter of pitchers do not follow the conventional first-pitch-fastball approach, and some of them, like Chris Sale of the Red Sox, have been remarkably successful doing so.
The data tell us that, in general, backwards pitchers are no more effective strategically (in terms of their ability to get hitters out) or tactically (in terms of their ability to throw offspeed or breaking pitches for strikes). Thus we cannot attribute the excellence of pitchers like Chris Sale to their tendency to start batters off with non-fastballs alone. Successful pitchers have many tools in their out-inducing toolbox, and some pitchers feature the "backwards" pitching tool prominently in theirs. As R.J Anderson concluded eloquently in a 2011 Baseball Prospectus study of backwards pitching: "it seems that different strokes work for different folks, and that most pitchers settle on a pattern well-suited to their stuff." It would seem that this observation still holds, seven seasons later.
Data Details
The analysis in this post used PITCHf/x data for the 2014-2018 Major League Baseball seasons, obtained via the pitchRx R package. I found that some pitcher names are missing in the PITCHf/x dataset; in these cases, I merged in names (by the MLB Advanced Media (MLB AM) player identifier) from the Chadwick Baseball Bureau Player Register. Some names are represented inconsistently, both within the PITCHf/x data, and between PITCHf/x and the Chadwick register; these were harmonized manually.
The PITCHf/x dataset includes the type of each pitch (i.e., classification of pitches as fastballs, sinkers, curveballs, etc.) as estimated by a machine learning model developed at MLB AM. Like any model, the MLB AM pitch identification algorithm makes incorrect classifications some of the time, a fact that has been discussed (and criticized somewhat) at Beyond the Boxscore, and in The Hardball Times, among other places. Analysts often point out that the algorithm is much better at distinguishing fastballs from non-fastballs than it is at distinguishing between, say, a two-seam fastball and a sinker, or between curveballs and sliders. So for purposes of the analysis in this post, which relies mostly on fastball versus non-fastball, the inherent error in the identification algorithm is likely not severe enough to invalidate the conclusions about pitching across the league for half of a season. Still, it is important to consider the conclusions in light of the errors in pitch identification.
In this analysis, a pitch is considered a "fastball" if PITCHf/x classifies it as fastball, two-seam fastball, four-seam fastball, cut fastball, or sinker. Analyses comparing pitchers considered only those pitchers who faced at least 30 batters during the first half of the 2018 season (meaning, regular season games played prior to the All Star Break, which started on July 16). A pitcher is considered a "starter" if he started at least 80 percent of the games in which he appeared, otherwise he is considered a "reliever".
You can find the source code for the analysis in my baseball analysis GitHub repo.