Topic Modeling and Visualization of Russian IRA Tweets
Posted: August 12, 2018
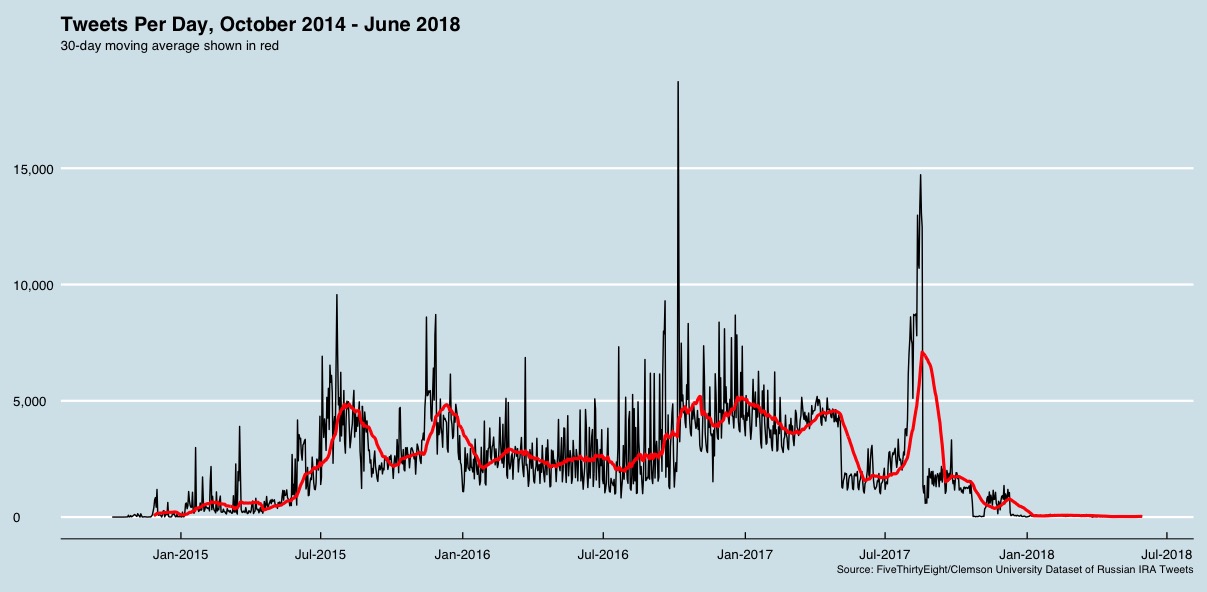
On July 31, 2018, FiveThirtyEight released a dataset of nearly 3 million tweets from accounts associated with the Russian government's Internet Research Agency (IRA). The dataset resulted from a research project led by Clemson University researchers Darren Linvill and Patrick Warren, who wrote a research paper describing the project. It presents us with an opportunity to understand the objectives and methods of the people operating these accounts, starting with the basic question: what topics did they tweet about, and how did those topics differ across the audiences targetted by the IRA?
Dataset Summary
The dataset contains 2,973,371 tweets published between February 2012 and May 2018, with almost all tweets occurring after October 2014:
Each tweet record contains the user name of the account that published the tweet, the date and time that the tweet was published,
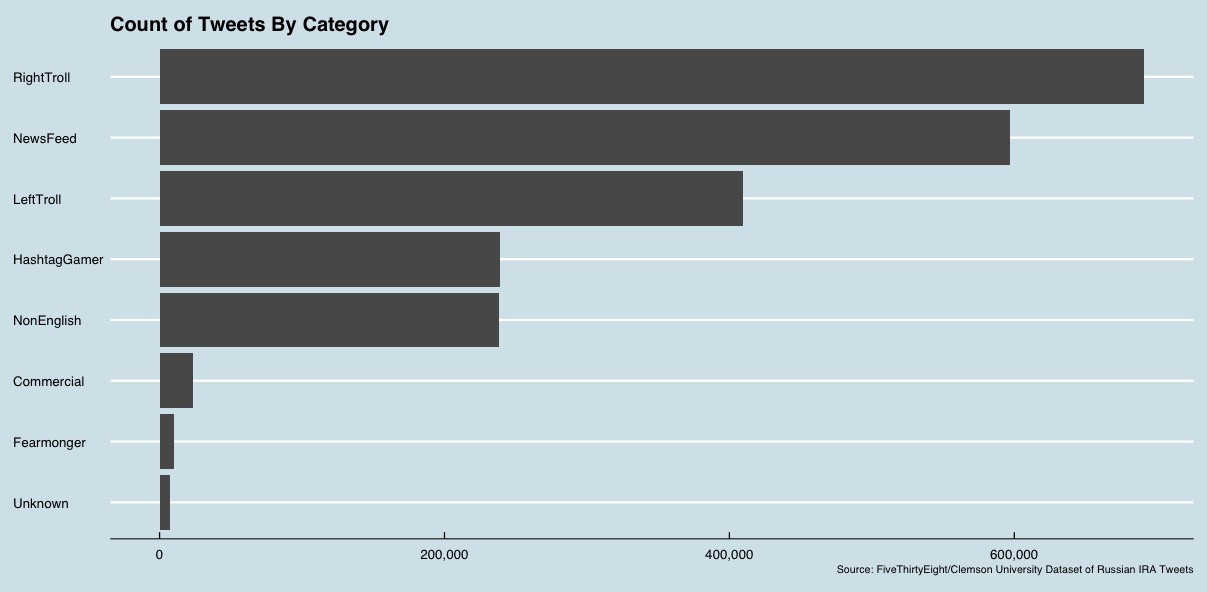
the tweet's language, whether the tweet was a retweet, the number of followers of the account and the number of accounts followed by the account, and the content of the tweet. Each record also contains a category
applied by Linvill and Warren:
After some initial exploratory analysis to establish a foundation for analysis, I performed some typical cleanup on the text of each tweet. Specifically, I removed punctuation, URLs, and "mentions" (i.e., @[account name] strings that occur in tweets to mention another account), normalized whitespace, and removed any tweets without contents. This left a dataset with 2,215,817 tweets.
Topic Modeling
I thought it would be interesting to look at the broad themes or topics in the tweets published by the LeftTroll and RightTroll accounts as classified by the Clemson researchers. To do so, I started by taking a 35% random sample of the tweets, just to make the processing go more quickly on my MacBook Pro; this resulted in 143,332 LeftTroll tweets and 241,978 RightTroll tweets. Next I removed common stop words, synthesized "co-located" words (e.g., the words "Donald" and "Trump" are joined to form a two-word term) if they co-occurred more than 50 times across the dataset, and removed all terms from analysis that occurred fewer than five times. I then fit a Latent Dirichlet Allocation (LDA) model, using a prior of 20 topics after experimenting with topic counts of 5, 10, and 30.
The topics learned by the model for the LeftTroll group, along with the 12 most relevant words in the topic and the labels I assigned based on my interpretation of them were:
| Topic # | Label | Top 12 Words in Topic |
|---|---|---|
| 1 | Music, Movies | music, watch, play, movie, book, tv, top, record, official, public, dj, artists |
| 2 | Uninterpretable/Mix | read, win, follow, ill, daily, night, leave, heres, la, st, de, join |
| 3 | Women, African-Americans | woman, #blackskinisnotacrime, beats, film, art, shes, photo, dope, mother, female, life, season |
| 4 | War (?) | love, #nowplaying, world, feat, war, truth, ya, peace, james, coming, life, head |
| 5 | Congressional votes (?) | vote, call, president, house, times, king, republicans, die, new_york, senate, voting, questions |
| 6 | Uninterpretable/Mix | hes, hate, didnt, party, game, lol, talking, lost, won, movement, mind, strong |
| 7 | Uninterpretable/Mix | free, feel, watch, stay, called, forget, wait, friends, power, share, sign, facebook |
| 8 | Marches, Videos | playing, live, video, #staywoke, chicago, #news, pm, march, father, release, red, south |
| 9 | Uninterpretable/Mix | family, home, care, child, run, breaking, americans, true, rights, country, remember, racial |
| 10 | Protesting | american, water, justice, star, government, word, freedom, political, stand, united, #nodapl, protest |
| 11 | Uninterpretable/Mix | life, ago, judge, found, president, dead, days, human, court, damn, worth, running |
| 12 | 2016 election, Politicians | trump, obama, gop, campaign, clinton, election, anti, business, calls, bill, trumps, republican |
| 13 | Uninterpretable/Mix | day, time, support, listen, happy, ive, tweet, power, words, twitter, deal, proud |
| 14 | Law Enforcement, Shootings, Black Lives Matter | police, #blacklivesmatter, cops, killed, cop, death, shot, shooting, gun, kill, arrested, officer |
| 15 | Uninterpretable/Mix, Expletives | shit, fuck, ass, million, change, bad, #god, remember, pay, wont, life, system |
| 16 | Law Enforcement, Black Lives Matter | #blacklivesmatter, money, #blm, #policebrutality, law, future, muslim, fire, community, post, #cops, #acab |
| 17 | Students, School | school, kids, girls, fight, students, beat, heart, beautiful, world, college, class, student |
| 18 | Music | real, yall, time, check, god, artist, ready, single, gotta, aint, song, hit |
| 19 | Race | black, people, white, women, racist, racism, history, america, #blacktwitter, race, #blackhistorymonth, color |
| 20 | Uninterpretable/Mix | youre, doesnt, news, media, wrong, stop, isnt, ppl, story, theyre, person, russia |
I thought it would be interesting to attempt to visualize the assignment of tweets to topics. The relevant output from the LDA model is a matrix θ that indicates the probability of each of the topics occurring
in each document. Visualizing a 143K+ x 20 matrix is challenging, but it is made much easier by using a dimensionality-reduction technique to attempt to reduce the 20 features (i.e., the topic distribution for each
tweet) down to 2. I decided to see what t-Distributed Stochastic Neighbor Embedding (t-SNE) could do here, and it turned out to be
quite effective, with one caveat. As it happens, for about half (49.3%) of the sampled LeftTroll tweets, the LDA model could not assign any topic with greater than a probability of .4. In other words, about half of the
LeftTroll tweets contained terms prominent in several topics, so that no single topic stood out as predominant. This could be due to a large number of tweets truly addressing multiple issues (or jumbling terms from
across topics), or it could be just a consequence of the number of topics selected or some other factor in how the model fitting occurred. In any case, t-SNE had difficulty clustering the tweets with this "no-predominant-topic"
tweets included, so we can consider them part of one additional "topic" and exclude them from the visualization. With some experimentation, I found that using a t-SNE perplexity hyperparameter of 30 resulted in the
cleanest clustering (I also tried 10, 20, and 50). The result, with each dot being a tweet and the color of each dot representing the likeliest topic for that tweet, is:
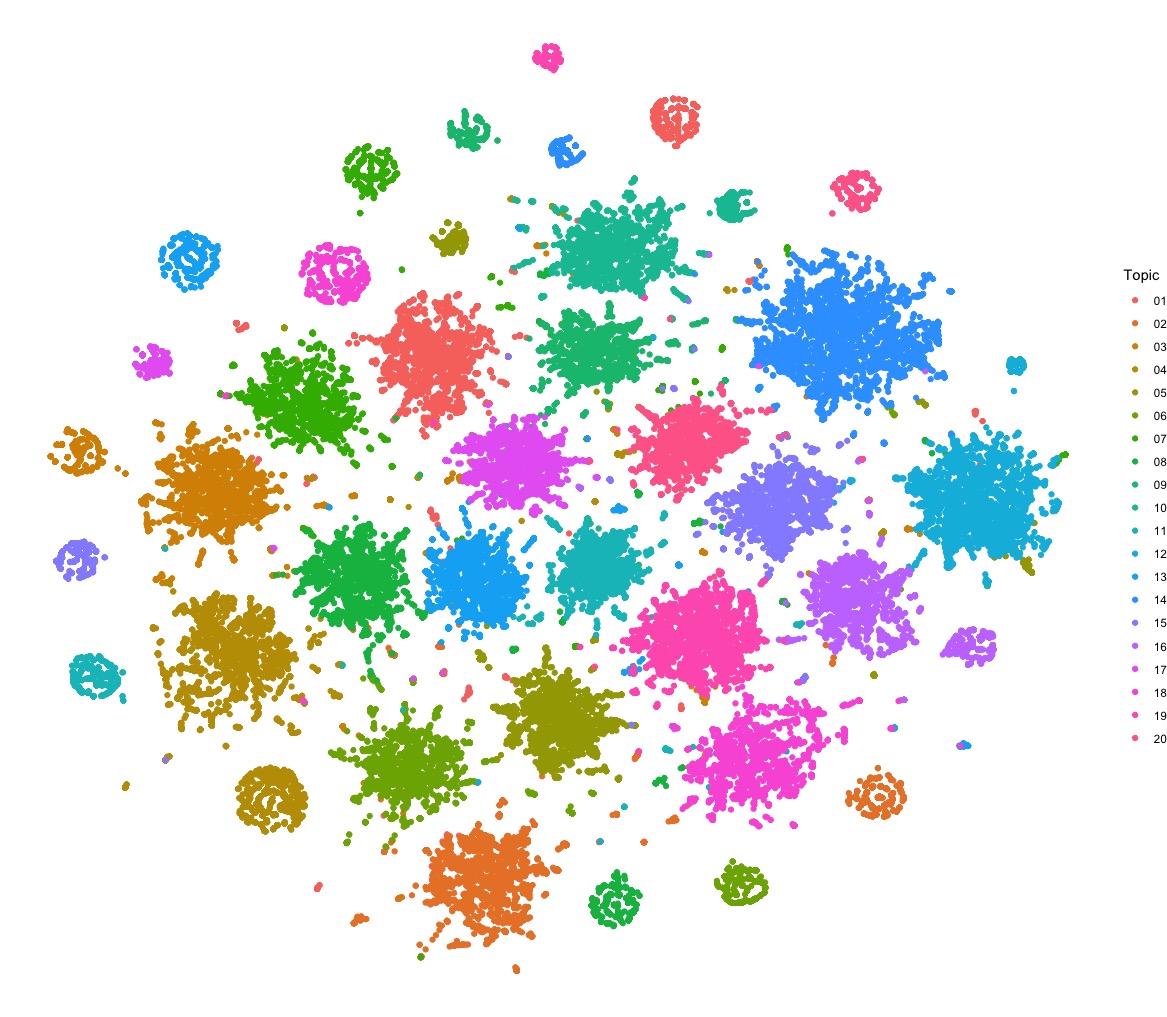
Note that there are actually 40 somewhat distinct clusters here, two for each of the 20 topics. The smaller clusters are tweets assigned to a topic with probability=1, while the larger clusters have a lower probability assignment to the likeliest topic. Overall, t-SNE with a perplexity hyperparameter of 30 seems to do a very good job at reducing the 20 columns in the θ matrix down to two for visualization.
The topics learned by the model for the RightTroll group were, not surprisingly, quite different:
| Topic # | Label | Top 12 Words in Topic |
|---|---|---|
| 1 | Terrorism, Islam, Guns | liberals, stop, hate, violence, gun, antifa, guns, left, terrorists, people, #islamkills, remember |
| 2 | Trump, Debates | life, god, donald_trump, #demdebate, #tcot, plan, #wakeupamerica, #pjnet, power, boy, tonight, candidate |
| 3 | Trump, (Fake) News | trump, president, cnn, white_house, report, news, claims, poll, fake_news, voters, dem, makes |
| 4 | Taxes, Immigration | america, money, fight, stand, enlist, jobs, pay, join, illegals, free, freedom, tax |
| 5 | Obama, Middle East | obama, military, deal, change, speech, president, words, obamas, iran, israel, death, trumps |
| 6 | Uninterpretable/Mix | law, racist, government, kids, public, race, takes, debate, california, person, lose, planned_parenthood |
| 7 | Congressional votes, Obamacare | trump, gop, bill, democrats, democrat, senate, breaking, republicans, republican, judge, national, obamacare |
| 8 | Mueller Investigation | clinton, russia, fbi, comey, hillary, mueller, russian, house, dnc, congress, investigation, breaking |
| 9 | Uninterpretable/Mix | liberal, live, day, bad, mt, happy, school, night, city, fire, chicago, won |
| 10 | Immigration, Elections | people, american, country, black, america, world, million, voted, donald_trump, times, refugees, immigration |
| 11 | Uninterpretable/Mix | watch, breaking, woman, nfl, video, arrested, #news, child, hit, hollywood, sex, florida |
| 12 | Uninterpretable/Mix | media, potus, realdonaldtrump, dems, truth, americans, #mar, job, #top, real, fake, msm |
| 13 | Islam, Terrorism | police, isis, muslim, attack, women, white, killed, muslims, islam, shooting, islamic, terrorist |
| 14 | Uninterpretable/Mix | lol, love, youre, read, stupid, doesnt, mccain, call, amazing, evil, press, pelosi |
| 15 | Charlottesville | trump, breaking, video, anti, charlottesville, viral, tweet, antifa, calls, wow, exposes, mayor |
| 16 | Uninterpretable/Mix | time, day, family, days, hope, week, home, office, remember, start, americans, leave |
| 17 | Uninterpretable/Mix | hillary, election, hillary_clinton, campaign, didnt, party, #sports, game, voting, book, mcmaster, lying |
| 18 | Uninterpretable/Mix | left, twitter, story, #topl, rr, post, call, rally, guy, called, trump_supporters, prison |
| 19 | North Korea, Nuclear Weapons | north_korea, war, trump, history, lost, china, coming, #politics, breaking, st, nuclear, major |
| 20 | Uninterpretable/Mix | #maga, vote, #trump, support, #top, follow, list, retweet, terror, #obama, flag, nation |
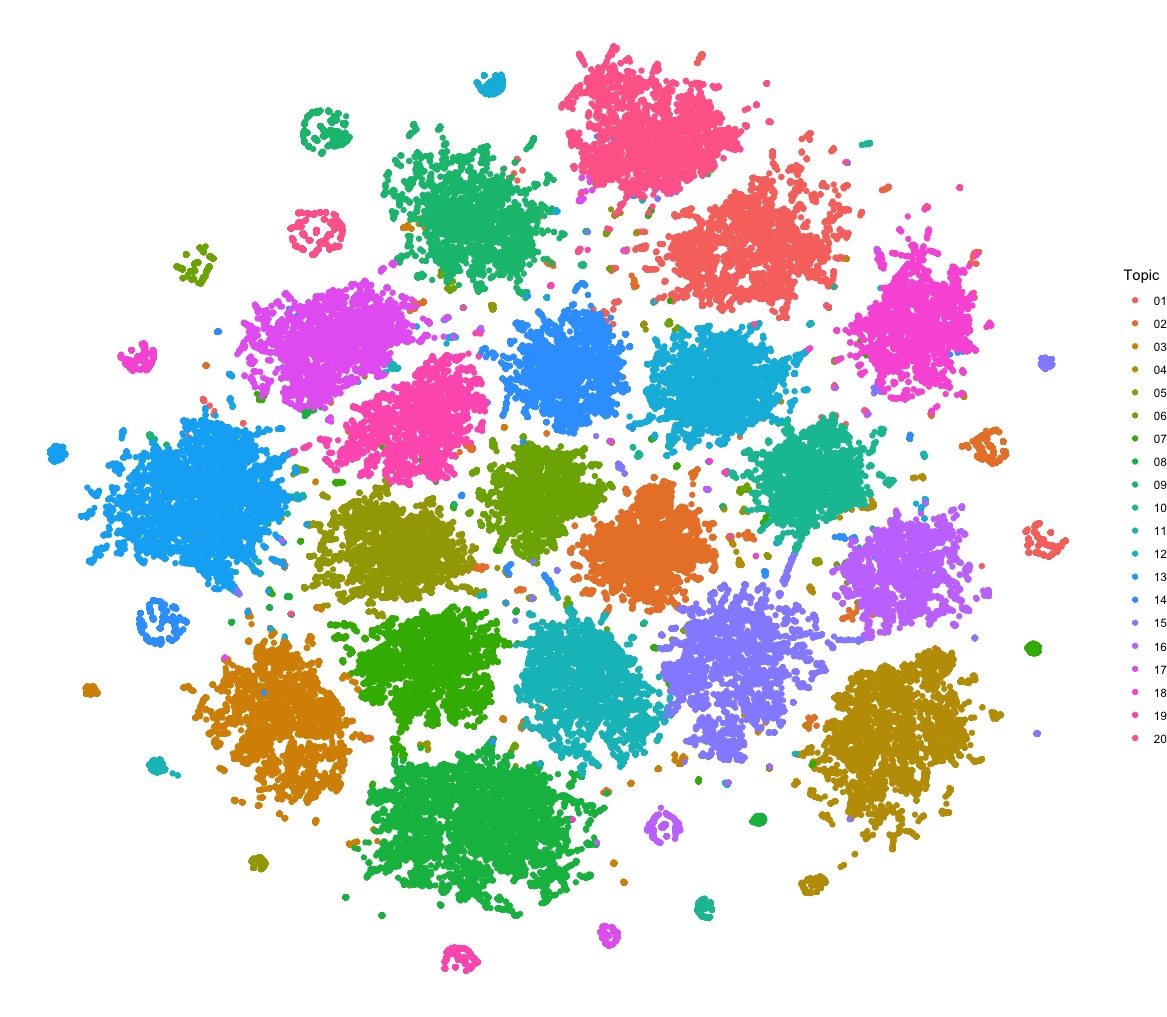
I was also not surprised to see that the t-SNE dimensionality reduction resulted in a very similar visualization of the θ matrix based on the 120,075 (49.6%) RightTroll tweets with a topic-assignment probability of at least .4:
One somewhat surprising observation I noticed through experimentation was that applying a Tf-Idf transformation to the document-term matrix resulted in similar clustering via t-SNE, but the interpretability of the topics (in terms of the words in each) was far worse. In fact, after the Tf-Idf transformation, I was unable to discern a clear interpretation for any of them. I have not yet explored the underlying reason for this observation, but I may do so in a subsequent blog post.
R Packages Used...and Code
I used the excellent text2vec R package (webpage, GitHub) for
all of the natural language processing (vocabulary construction, determination of co-located terms, building the
document-term matrix for each sample of tweets) and fitting of the LDA model underlying the analysis presented above. I used the Rtsne package (GitHub)
for applying t-SNE dimensionality reduction to the θ matrix.
The code to create the graphics for the post is available in my GitHub repository.