Sierra Leone Census R Package
Posted: May 21, 2017
As part of supporting a project analyzing data from the 117 Call Center that eHealth Africa helped establish in Sierra Leone, I found myself needing to extract many of the tables from the published results of Sierra Leone’s 2015 Census of Population and Housing. The census results are only available in PDF form from the website of Statistics Sierra Leone, but my goal was to expose them via an R package, so I could easily merge them with the other data assembled as part of the project. This was a perfect task to tackle with the tabulizer package from the rOpenSci project, which makes conversion of PDF tables into R data frames a snap.
The extract_tables() function in tabulizer does much of the work of converting PDF tables to data frames, and in some applications it can make fairly good guesses at table boundaries, rows, columns, and headings. However, sometimes we need just one table—or a portion of a table—appearing on a page, and sometimes tables span pages. The extract_tables() function generally needs some help to handle these scenarios.
The help comes in the form of the areas parameter passed to extract_tables(); this parameter allows us to restrict tabulizer’s extraction to a specified portion of the page. The best way to determine the area is to use one of the tabulizer package’s nicest features: the locate_areas() function, which opens a graphical interface in RStudio’s Viewer pane to allow the user to highlight the area encompassing the table’s boundaries.
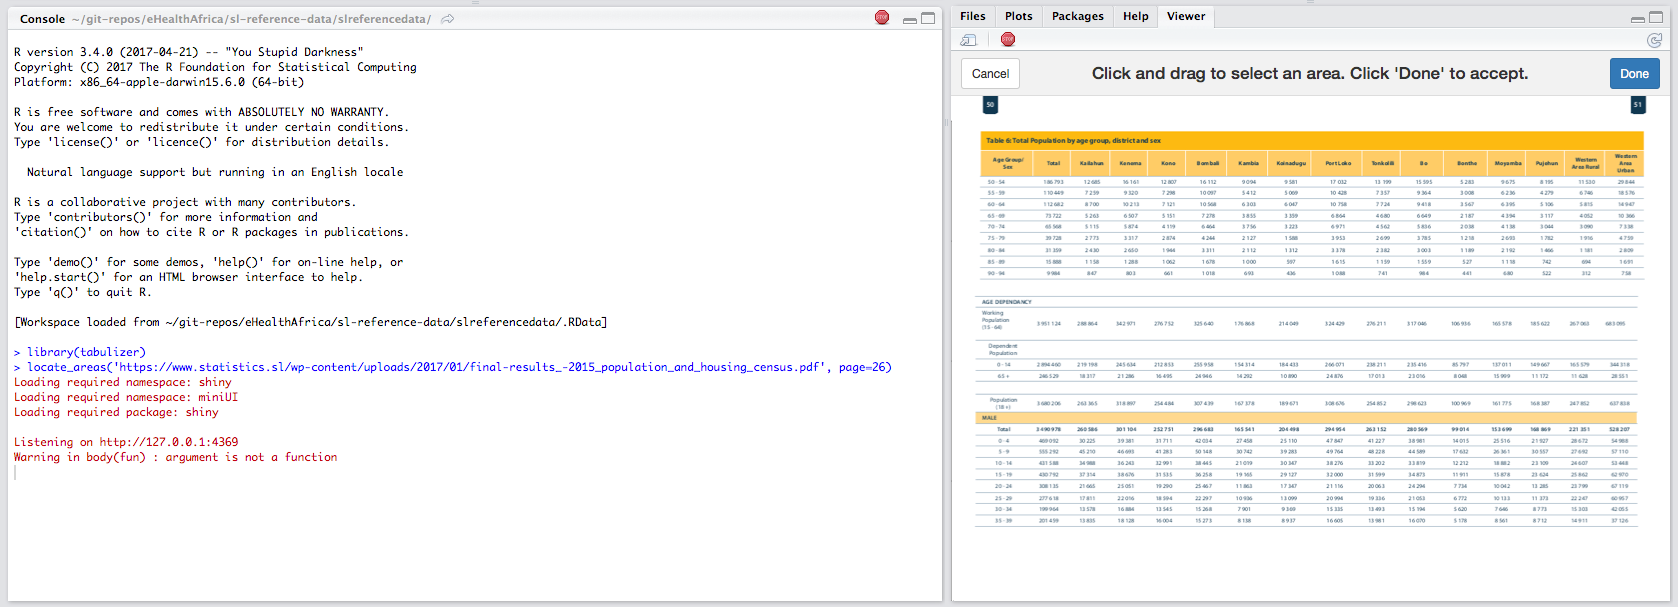 After completing the selection, locate_areas() returns the coordinates of the highlighted area, which then can be used in extract_tables(). I found that it often requires a bit of trial- and-error to get the coordinates just right, but once that is done, tabulizer did a great job extracting the tables from this PDF. After a little bit of tidying, I had two data frames suitable for merging with aggregated call center data: one at the District level and one at the Chiefdom level.
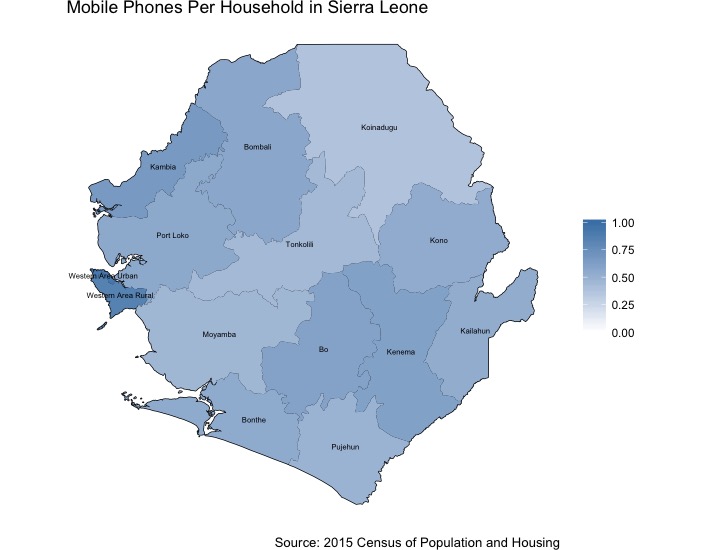
I added the final data frames as exported objects in the slreferencedata package, which is available on GitHub. This package (which we view as something we can continue to build out as projects’ data needs grow) also includes shapefiles published by the government of Sierra Leone (via the United Nations) for Chiefdom and District boundaries. The combination of census data and shapefiles allows for building interesting visualizations of population characteristics, like households’ access to mobile phones:
library(tidyverse)
library(ggplot2)
library(sp)

DistrictData <- slreferencedata::Census2015ByDistrict %>% select(Households, HouseholdsMobilePhoneYes, District) %>%
  mutate(MobilePhonePerHousehold=HouseholdsMobilePhoneYes/Households)

districtShp <- slreferencedata::DistrictPolygons
districtShpDf <- fortify(districtShp) %>%
  inner_join(districtShp@data, by='id') %>%
  inner_join(DistrictData, by=c('admin2Name'='District'))

centroids <- coordinates(districtShp) %>% as_tibble() %>% rename(long=V1, lat=V2) %>%
  mutate(DistrictLabel=districtShp@data$admin2Name)

ggplot(data=districtShpDf, aes(x=long, y=lat, group=group)) +
  geom_path(color="black") +
  scale_fill_gradient(limits=c(0,1), low = "white", high = "steelblue", na.value = "grey90", guide = "colourbar") +
  geom_polygon(aes(fill=MobilePhonePerHousehold)) +
  geom_text(data=centroids, mapping=aes(x=long, y=lat, label=DistrictLabel), inherit.aes=FALSE, size=2.5) +
  coord_map(projection="mercator") + theme_void() +
  labs(title='Mobile Phones Per Household in Sierra Leone', caption='Source: 2015 Census of Population and Housing', fill=NULL)
To learn more about eHealth Africa's work digitizing health solutions in Sierra Leone, read their recent blog post.